まずはこの3つ
- 何のグラフか1文→目立つ特徴を1〜2点だけ
- 原因は probably / may で推測、断定しない
- 自分で増えるのは rise(raise は他動詞)
数字を順番に全部書くと、語数を食うだけで「何が言いたいか」が消える。採点者が見たいのは、データの中から一番大事な変化や差を選び、それを根拠に考えを述べる力だ。最大・最小・急な変化・逆転の4つを探せば、書くべき特徴はほぼ見つかる。
グラフの種類と書くこと
| 種類 | 何を表す? | 中心になる表現 |
|---|---|---|
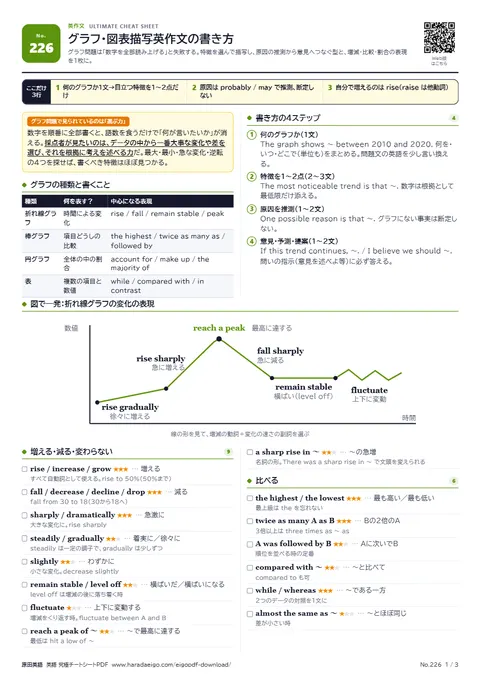
| 折れ線グラフ | 時間による変化 | rise / fall / remain stable / peak |
| 棒グラフ | 項目どうしの比較 | the highest / twice as many as / followed by |
| 円グラフ | 全体の中の割合 | account for / make up / the majority of |
| 表 | 複数の項目と数値 | while / compared with / in contrast |
書き方の4ステップ4
- 1何のグラフか(1文)The graph shows 〜 between 2010 and 2020. 何を・いつ・どこで(単位も)をまとめる。問題文の英語を少し言い換える。
- 2特徴を1〜2点(2〜3文)The most noticeable trend is that 〜. 数字は根拠として最低限だけ添える。
- 3原因を推測(1〜2文)One possible reason is that 〜. グラフにない事実は断定しない。
- 4意見・予測・提案(1〜2文)If this trend continues, 〜. / I believe we should 〜. 問いの指示(意見を述べよ等)に必ず答える。
図で一発:折れ線グラフの変化の表現
増える・減る・変わらない9
- rise / increase / grow★★★増えるすべて自動詞として使える。rise to 50%(50%まで)
- fall / decrease / decline / drop★★★減るfall from 30 to 18(30から18へ)
- sharply / dramatically★★★急激に大きな変化に。rise sharply
- steadily / gradually★★★着実に/徐々にsteadily は一定の調子で、gradually は少しずつ
- slightly★★★わずかに小さな変化。decrease slightly
- remain stable / level off★★★横ばいだ/横ばいになるlevel off は増減の後に落ち着く時
- fluctuate★★★上下に変動する増減をくり返す時。fluctuate between A and B
- reach a peak of 〜★★★〜で最高に達する最低は hit a low of 〜
- a sharp rise in 〜★★★〜の急増名詞の形。There was a sharp rise in 〜 で文頭を変えられる
比べる6
- the highest / the lowest★★★最も高い/最も低い最上級は the を忘れない
- twice as many A as B★★★Bの2倍のA3倍以上は three times as 〜 as
- A was followed by B★★★Aに次いでB順位を並べる時の定番
- compared with 〜★★★〜と比べてcompared to も可
- while / whereas★★★〜である一方2つのデータの対照を1文に
- almost the same as 〜★★★〜とほぼ同じ差が小さい時
割合を言う6
- account for 〜 percent★★★〜%を占めるmake up 〜 percent も同じ
- more than half of 〜★★★〜の半数を超えるjust over half(半分をわずかに超える)も
- one in five 〜★★★5人に1人の〜20 percent の言い換え
- a quarter of 〜★★★〜の4分の1three quarters=4分の3
- the majority of 〜★★★〜の過半数・多数少数派は a small minority of 〜
- about / nearly / just over★★★約/ほぼ(届かない)/わずかに超えるnearly 50% は50%に少し足りない
数字の書き方のルール5
- 1数字で文を始めない文頭の数字は単語で書くか、語順を変えるのが英文の慣習。Thirty percent of students walk to school.生徒の30%が徒歩で通学する✕30% of students walk to school.
- 2小さい数は単語で一般に1〜9は単語、10以上は数字で書くことが多い(スタイルにより異なる)。割合・年・単位つきの数は数字でよい。
- 3期間の言い方from 2010 to 2020 / between 2010 and 2020。年代は in the 2010s(2010年代)。Sales rose steadily between 2010 and 2020.売上は2010年から2020年にかけて着実に伸びた
- 4大きな数1,500,000 は 1.5 million。数詞の後の million・billion に s は付けない(millions of people は可)。The city has a population of 1.5 million.その市の人口は150万人だ
- 5percent と percentagepercent は数字の後(30 percent)。数字なしで「割合」と言うなら percentage が普通。割合は high / low で表す。The percentage of elderly people is high.高齢者の割合が高い✕The percent of elderly people is many.
データから意見へつなぐ5
- This suggests that 〜.★★★これは〜を示唆しているshow より控えめ。データの解釈に
- One possible reason is that 〜.★★★考えられる理由の1つは〜原因を断定しない言い方
- This is probably because 〜.★★★これはおそらく〜だからだprobably で推測であることを示す
- If this trend continues, 〜.★★★この傾向が続けば〜予測から提案へつなぐ
- To solve this problem, we should 〜.★★★この問題を解決するために〜すべきだ提案で締める
グラフ描写で減点されるミス4
- ✕The number of tourists raised.○The number of tourists rose.raise は他動詞(〜を上げる)。自分で増えるのは rise。
- ✕People who pay by smartphone are increasing.○The number of people who pay by smartphone is increasing.増えるのは「人」ではなく「人数」。主語は the number。
- ✕The rate rose from 10% to 15%, a 5% increase.○The rate rose from 10% to 15%, an increase of five percentage points.割合どうしの差はポイント。5%増と書くと別の意味になる。
- ✕It increased to 20%.(20%分増えた の意味で)○It increased by 20%.to=その値まで、by=その分だけ。前置詞1つで数値が変わる。
練習用データ(架空):ある市の高校生の1日の平均時間
| 年 | 読書(分) | スマホ(分) |
|---|---|---|
| 2014 | 30 | 60 |
| 2017 | 24 | 95 |
| 2020 | 18 | 140 |
| 2023 | 19 | 150 |
The table shows how many minutes high school students in a city spent reading and using smartphones per day between 2014 and 2023. The most noticeable trend is that smartphone use rose sharply, from 60 to 150 minutes. In contrast, reading time fell from 30 to 18 minutes by 2020 and then remained almost unchanged. In 2023, students spent nearly eight times as long on their phones as on reading. One possible reason is that more entertainment became available on smartphones. If this trend continues, students may lose the habit of reading. Therefore, I believe schools should set aside time for reading every day. / 描写2文→比較1文→推測→予測→提案。2020年以降の小さな増加は「ほぼ変わらない」とまとめた。
確認テスト
- 1The number of visitors sharply in 2020.正解は fell。fall-fell-fallen。raise は他動詞。
- 2Women 60 percent of the workers.正解は account for。割合を占める=account for。
- 3Prices increased 10 percent, from 200 yen to 220 yen.正解は by。増えた分は by。
- 4The of students who own a smartphone is very high.正解は percentage。名詞の「割合」は percentage。
グラフ描写英作文を一覧にまとめ、A4 3枚で印刷できる無料PDFにしました。Web版は赤シート・覚えたチェック・カード・4択テストつき。