International Day of Happiness
国際幸福デーの英語の授業アイデアとワークシート
印刷してすぐ使えるワークシート(PDF・Word・解答つき)と、授業の手順書。
🖨️Worksheetsワークシート(無料・A4)
① 「中身を見る・印刷」で全ページを確認 → ② そのページ上の 🖨️ 印刷する でそのまま印刷できます。A4・無料。
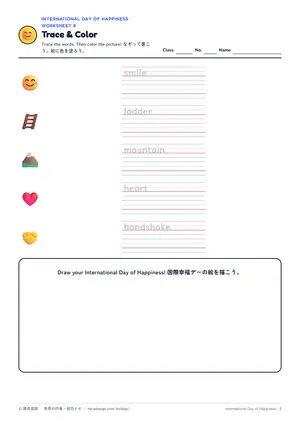
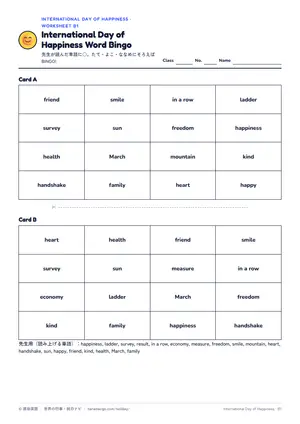
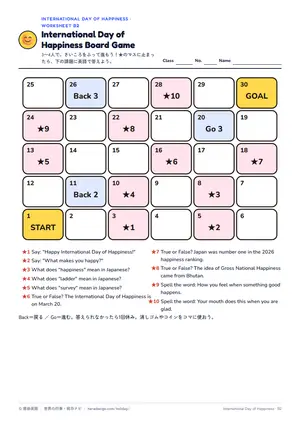
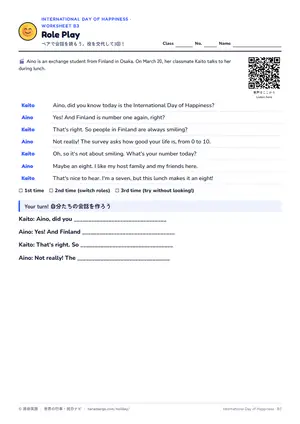
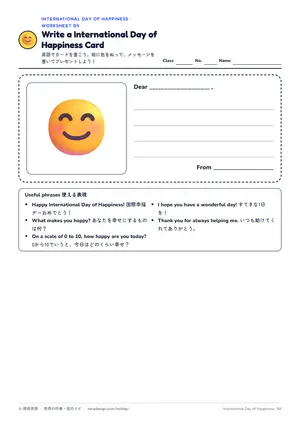
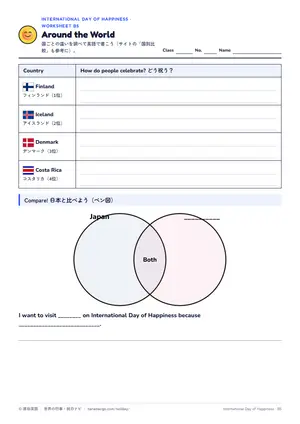
🍎Lesson Ideas国際幸福デーを使った英語の授業アイデア
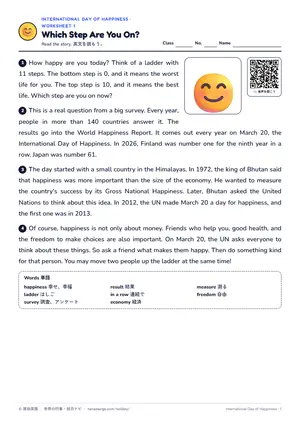
クラスの幸せのはしご調査
🎯 On a scale of 0 to 10, ~? の質問と because の理由づけを使って、英語でインタビューをする。
- 世界幸福度報告の「はしごの質問」を英語で紹介する。
- ペアで How happy are you today, on a scale of 0 to 10? Why? とインタビューし合う(数字だけ答えたくない人はパスしてよい)。
- クラスで「幸せの理由」に多かった言葉(friends / family / food など)を英語で集計する。
- 結果を The most popular reason was ~. の文で発表する。
詳細版を開く(時間配分・Teacher Talk・板書)
はしごの絵を黒板にはり、0がいちばんひどい生活、10がいちばん理想的な生活であることを英語で示す。これは世界幸福度報告で使われている本物の質問で、毎年140をこえる国の人々が答え、結果は3月20日の国際幸福デーに発表されることを伝える。
🗣️ Look at this ladder. It has 11 steps, from 0 to 10. / 10 is the best life. 0 is the worst life. / Every year, people in more than 140 countries answer this question.
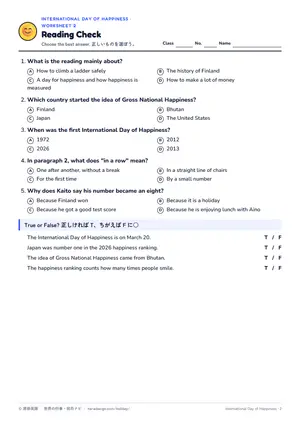
会話の音声を聞かせ、アイノの Maybe an eight. とカイトの I'm a seven. を取り出して、数字の答え方を確認する。because で理由を続ける練習を全員でする。数字を言いたくない人は Pass. と言い、理由だけ答えてよいことを最初に約束する。
🗣️ Listen to Kaito and Aino. / Aino says, "Maybe an eight." Kaito says, "I'm a seven." / You can say, "Pass," and just give a reason.
教室を歩いて5人にインタビューさせる。On a scale of 0 to 10, how happy are you today? Why? と聞き、相手の答えをシートに書かせる。答えた人には Thank you. や That's nice. と一言返すよう指示する。
🗣️ Stand up and talk to five friends. / Ask, "On a scale of 0 to 10, how happy are you today? Why?" / Write their reasons on your sheet.
自分の幸せの理由を英語1語(friends / family / food など)で付せんに書かせ、黒板にはらせる。同じ語ごとにまとめ、全員で数える。数字の集計はしない。
🗣️ Write your reason on a sticky note. One word is OK. / Put it on the board. / Let's count. How many people wrote "friends"?
集計を見て The most popular reason was ~. の文を何人かに言わせる。本文の最後の段落にある「友だちに何が幸せかを聞き、その人のためにやさしいことをする」という呼びかけを紹介して終える。
🗣️ What was the most popular reason? / Say, "The most popular reason was ..." / Ask a friend what makes them happy. Then do something kind.
International Day of Happiness(March 20)😊
🪜 0(the worst life)〜 10(the best life)

A:On a scale of 0 to 10, how happy are you today? Why?
B:I'm a ___ because ___.
 (数字は Pass してもよい)

Reasons:friends / family / food / ...
The most popular reason was ___.
GDPか、幸せか:国の成績表をつくろう
🎯 数字で表せる豊かさと幸福のちがいを考え、英語で意見を述べる。
- ブータンの国民総幸福量と、世界幸福度報告の6つの要素を英文で読む。
- グループで「自分たちの町の幸せを測るなら、どんな項目を入れるか」を5つ選ぶ。
- We chose ~ because ~. の形で発表し、ほかのグループの項目とくらべる。
- ブータンへの批判にもふれ、数字で幸せを測ることの長所と短所を書く。
詳細版を開く(時間配分・Teacher Talk・板書)
第3段落を聞かせ、1972年にブータンの国王が「国民総幸福量はGDPより大切」と言ったことを確認する。次に国別比べ表を見せ、日本は2025年の55位(6.147点)から2026年は61位(6.130点)になったが、点数の差は0.017点だけだったことに気づかせる。
🗣️ In 1972, the king of Bhutan said happiness was more important than the size of the economy. / Look at Japan. Its score was almost the same, but its rank went down. / Why do you think that happened?
6つの要素の英語リストを読ませ、報告はこれらで点数の差を説明しているが、点数そのものは0〜10のはしごの質問から出ることを確認する。自分にとって大切な要素を3つ選ばせ、ペアで理由を言い合わせる。
🗣️ The report looks at six things. / They explain the scores. They do not make the scores. / Which three are most important to you? Tell your partner why.
グループで「自分たちの町の幸せを測るなら」という成績表をつくらせる。項目を5つ選び、それぞれの測り方(アンケートの質問か数字)も書かせる。ブータンの調査が心の健康・時間の使い方・地域のつながり・自然・暮らしの水準などの分野を調べていることを、ヒントとして紹介する。
🗣️ Make a report card for our town. / Choose five things to measure. / How will you measure each one? Think of a question or a number.
1グループ1分で、We chose ~ because ~. の形で成績表を発表させる。聞いているグループには、自分たちと同じ項目とちがう項目をメモさせる。
🗣️ Each group has one minute. / Say, "We chose ... because ..." / Which items are the same as yours? Which are different?
ブータン自身は2019年の報告で156か国中95位だったこと、1990年代にネパール系の住民10万人以上(当時の人口の約6分の1)が国を追われ、「幸せの宣伝で人権問題をかくしている」という批判もあることを伝える。そのうえで、数字で幸せを測ることの長所と短所を、One good point is ~. One problem is ~. の形で1つずつ書かせて提出させる。
🗣️ Bhutan was number 95 out of 156 countries in 2019. / Some people also say Bhutan has a human rights problem. / Write one good point and one problem about measuring happiness with numbers.
GDP or Happiness?
1972 Bhutan:Gross National Happiness(GNH)> GDP
2012 UN:March 20 = International Day of Happiness

World Happiness Report 2026
1 Finland 7.764 / 2 Iceland 7.540 / 3 Denmark 7.539 / 4 Costa Rica 7.439
Japan:61(6.130)← 2025:55(6.147)

6 factors(explain the scores)
GDP per person / support / healthy life / freedom / generosity / little corruption

We chose ___ because ___.
One good point is ___. One problem is ___.