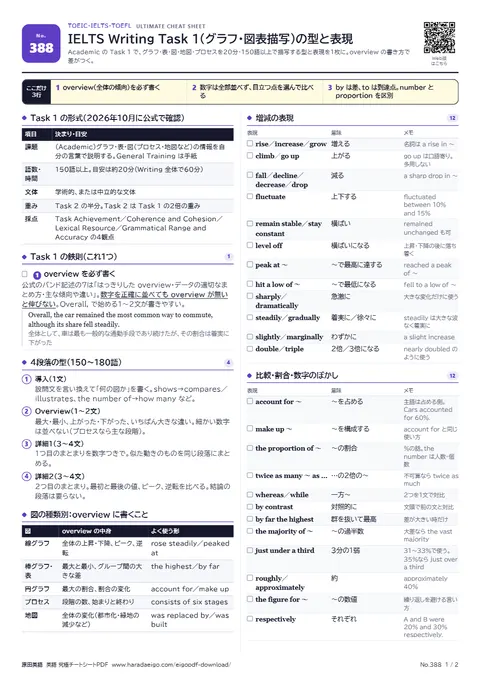
まずはこの3つ
- overview(全体の傾向)を必ず書く
- 数字は全部並べず、目立つ点を選んで比べる
- by は差、to は到達点。number と proportion を区別
Task 1 の形式(2026年10月に公式で確認)
| 項目 | 決まり・目安 |
|---|---|
| 課題 | (Academic)グラフ・表・図(プロセス・地図など)の情報を自分の言葉で説明する。General Training は手紙 |
| 語数・時間 | 150語以上。目安は約20分(Writing 全体で60分) |
| 文体 | 学術的、または中立的な文体 |
| 重み | Task 2 の半分。Task 2 は Task 1 の2倍の重み |
| 採点 | Task Achievement/Coherence and Cohesion/Lexical Resource/Grammatical Range and Accuracy の4観点 |
Task 1 の鉄則(これ1つ)1
- 1overview を必ず書く公式のバンド記述の7は「はっきりした overview・データの適切なまとめ方・主な傾向や違い」。数字を正確に並べても overview が無いと伸びない。Overall, で始める1〜2文が書きやすい。Overall, the car remained the most common way to commute, although its share fell steadily.全体として、車は最も一般的な通勤手段であり続けたが、その割合は着実に下がった
4段落の型(150〜180語)4
- 1導入(1文)設問文を言い換えて「何の図か」を書く。shows→compares/illustrates、the number of→how many など。
- 2Overview(1〜2文)最大・最小、上がった・下がった、いちばん大きな違い。細かい数字は並べない(プロセスなら主な段階)。
- 3詳細1(3〜4文)1つ目のまとまりを数字つきで。似た動きのものを同じ段落にまとめる。
- 4詳細2(3〜4文)2つ目のまとまり。最初と最後の値、ピーク、逆転を比べる。結論の段落は要らない。
図の種類別:overview に書くこと
| 図 | overview の中身 | よく使う形 |
|---|---|---|
| 線グラフ | 全体の上昇・下降、ピーク、逆転 | rose steadily/peaked at |
| 棒グラフ・表 | 最大と最小、グループ間の大きな差 | the highest/by far |
| 円グラフ | 最大の割合、割合の変化 | account for/make up |
| プロセス | 段階の数、始まりと終わり | consists of six stages |
| 地図 | 全体の変化(都市化・緑地の減少など) | was replaced by/was built |
増減の表現12
比較・割合・数字のぼかし12
プロセス・地図の表現7
- The process consists of six stages.その工程は6段階から成るoverview の書き出し。始まりと終わりも1文で
- The beans are first harvested and then dried in the sun.豆はまず収穫され、天日で乾燥される人が行う工程は現在形の受動態が多い(自然の循環は能動態も)
- Once the mixture has cooled, it is poured into molds.混合物が冷めると、型に流し込まれるOnce +現在完了で段階をつなぐ。英つづりは moulds
- In the final stage, the products are packed and delivered.最終段階で製品は梱包され配送されるfirst/next/after that/finally で順序
- The forest was cleared to make way for a housing estate.森は住宅地を造るために切り開かれた地図の変化は受動態が多い。時制は図の年に合わせる
- A parking lot was built to the north of the station.駅の北に駐車場が建設された位置は to the north of。英では car park
- The old factory was replaced by a shopping mall.古い工場はショッピングセンターに置き換えられた変化の定番。was converted into も可
モデル答案の図(オリジナル)
設問:ある国の通勤者のうち、車・電車・自転車で通勤する人の割合(2000〜2020年)を示した線グラフ。
| 年 | 車 | 電車 | 自転車 |
|---|---|---|---|
| 2000 | 60% | 25% | 5% |
| 2010 | 52% | 31% | 8% |
| 2020 | 45% | 30% | 15% |
【導入】The line graph compares the proportion of commuters in one country who travelled to work by car, train and bicycle between 2000 and 2020. 【Overview】Overall, the car remained the most common way to commute throughout the period, although its share fell steadily. By contrast, cycling became considerably more popular, while train use rose before levelling off. 【詳細1】In 2000, 60% of commuters drove to work, more than twice the figure for the train (25%). Over the next two decades, the proportion of car users declined gradually, falling to 52% in 2010 and 45% in 2020. 【詳細2】The share of train users rose to 31% in 2010 and then remained relatively stable, ending the period at 30%. Cycling, the least common option at only 5% in 2000, grew slowly at first, to 8% in 2010, but then nearly doubled to 15% by 2020. As a result, the gap between cycling and the other two modes narrowed noticeably. Even so, three times as many people drove to work as cycled in 2020.
減点されやすい所6
- ✕The number of students rose from 20% to 35%.○The proportion of students rose from 20% to 35%.%なら proportion/percentage。number は実数
- ✕Sales increased to 20%.(20%分増えた、のつもり)○Sales increased by 20%.by は増えた幅、to は到達した値
- ✕The amount of cars increased.○The number of cars increased.可算名詞は number、不可算は amount
- ✕This is probably because petrol became expensive.○図に示された変化だけを書く図にない原因の推測は課題からずれる
- ✕すべての年・すべての数字を並べる○最初・最後・ピーク・逆転を選ぶ選んで比べる力が Task Achievement
- ✕設問文をそのまま写して導入にする○語と語順を言い換える設問から写した部分は評価から外される(公式の注記)
時制は図の年で決める。過去の年なら過去形、予測(2030年など)なら is expected to/is predicted to、年のない図・プロセスは現在形。1つの答案で時制が揺れると Grammatical Range and Accuracy に響く。
確認テスト
- 1Task 1 の最低語数は?正解は 150語。目安は約20分
- 2Prices rose 10 dollars to 50 dollars.(10ドル上がった)正解は by。by は差。to は到達点
- 3overview に入れないものは?正解は 細かい数字。数字は詳細の段落で
- 4製品を作る工程のプロセス図で、基本の時制と態は?正解は 現在形の受動態。is harvested/are packed
参考にした資料
IELTS Writing Taskを一覧にまとめ、A4 2枚で印刷できる無料PDFにしました。Web版は赤シート・覚えたチェック・カード・4択テストつき。